
Operations Dashboard
production efficiency
“Lean process, visible results”
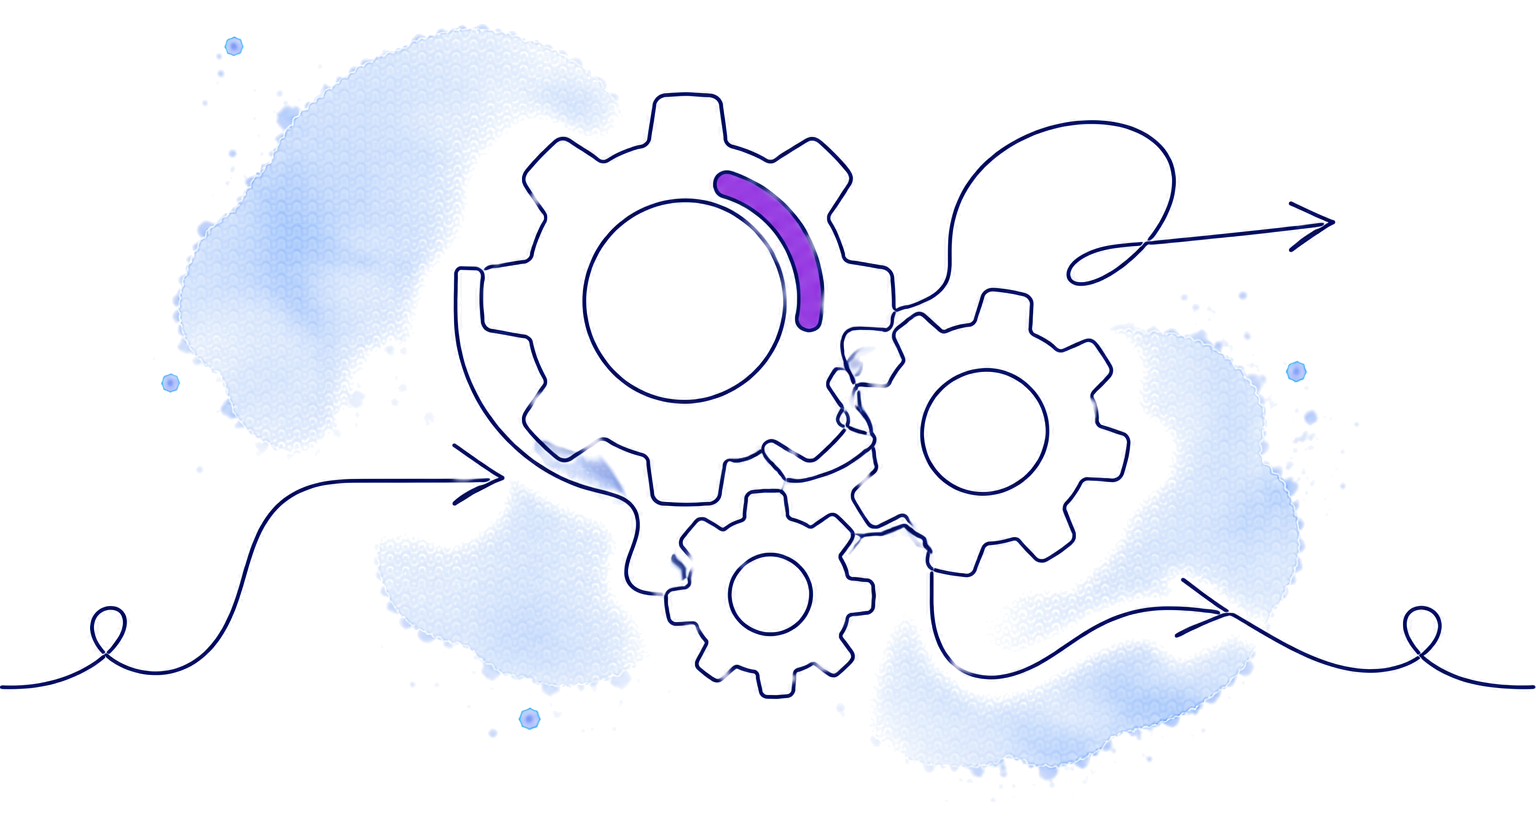
Joins productivity per line with downtime history to explain volume swings. Slicing by shift exposes execution differences that the daily average hides. Aimed at plants with production reporting and maintenance records.

Navigation
- Overview
- Productivity
- Downtime
Typical filters
- Year
- Month
- Line/Cell
- Shift
Suggested data sources
- MES/ERP
- Production reporting
- Maintenance
Decorative elements